In the last 8 years we’ve seen our fair share of SEO reports from other agencies, freelancers etc. They’re often full of numbers, domain authority, impressions, bounce rate, and more. While some of it does matter, a lot of it just makes your eyes glaze over. Regardless of how good the numbers look, chances are what you want to know is if the SEO is worth the money you’re forking out for it.
This blog breaks down the most common SEO metrics you’ll see in reports, what they mean, and which you should pay the most attention to.
The difference between domain rating (DR) and domain authority (DA).
Domain Authority (DA) and Domain Rating (DR) are often used interchangeably, but they come from different tools and are calculated in slightly different ways.
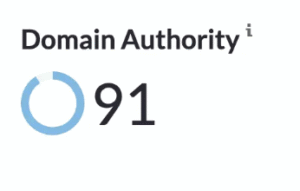
Domain Authority (DA) is a score developed by Moz. It estimates how likely a website is to rank in search engines, based mainly on the quality and quantity of backlinks. It uses a scale from 0 to 100 — the higher the number, the stronger your site is seen to be. It’s best used as a rough benchmark against competitors.
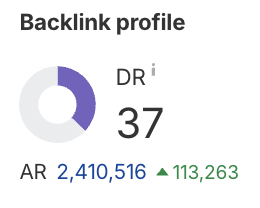
Domain Rating (DR) is a similar score, but it comes from Ahrefs. Like DA, it’s based on your backlink profile, but the way it’s calculated is slightly different — Ahrefs puts more weight on the strength of the linking domains and their own authority. DR also uses a 0 to 100 scale.
Both scores are estimates. Neither is used by Google, and neither tells you how well your site is performing in real terms. They’re helpful for seeing if you’re moving in the right direction link-wise, but they won’t tell you if your content is working or if your pages are converting.
In short:
| Metric | Source | Based on | Good for | Not good for |
|---|---|---|---|---|
| DA | Moz | Links to your site | Comparing with competitors | Measuring actual performance |
| DR | Ahrefs | Strength and quality of backlinks | Tracking authority growth | Predicting rankings |
Page Authority, URL Rating, Authority Score..
Page Authority (PA) is a metric created by Moz. It scores an individual page (0–100) based on the quantity and quality of links pointing to it. The higher the score, the more likely that page is to rank well — in theory.
It’s useful for spotting which pages have strong link profiles, but it doesn’t factor in content quality, relevance, or user behaviour.
Other tools like Ahrefs and Semrush don’t use PA — they have their own page-level metrics (like Ahrefs’ URL Rating or Semrush’s Authority Score), but the idea is similar: measuring how strong a page is based on backlinks.
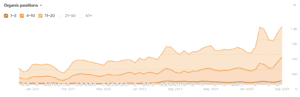
Keyword Rankings
This tells you where your pages are showing up for different search terms.
It’s easy to see a growing list of keywords in a report and assume that’s a good thing. But it’s not about how many you’re ranking for it’s about whether they’re the right ones.
You could be ranking for 1,000 random phrases that never lead to anything. What matters is whether you’re showing up when people are actively looking for something you offer. Quality and intent should be your key focus.
Impressions
This shows how often your pages are appearing in search results. A rise in impressions can be a good early sign that your visibility is improving. But high impressions with hardly any clicks usually means you’re showing up for the wrong things.
It’s worth tracking, but on its own, it doesn’t tell you much about performance. Pair it with click-through rate to see what’s actually working.
Click-Through Rate (CTR)
This shows the percentage of people who see your page in search results and decide to click.
A good CTR usually means your title and description are doing their job, catching attention and matching what people are looking for.
But it’s not the full story. You can have a high CTR and still no conversions if the page doesn’t deliver. Use it as a sign of how well you’re attracting clicks, then look at what happens after they land.
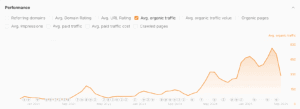
Organic Traffic
Perhaps the most reported metric. Traffic is important. It’s the first step, because if no one’s finding your site, nothing else can happen.
But it’s just as important to monitor what that traffic does. You can have thousands of visitors and still get no conversions if the keywords bringing them in have the wrong intent. This is something we see a lot with sites that rely heavily on blog content. They end up ranking really well for informational searches, but not for the keywords that actually drive enquiries or sales. And often, the key converting pages, like product or service pages have barely been touched.
New vs Returning Visitors
This shows how many people are finding your site for the first time, compared to those coming back for another look. It can give you a rough sense of brand awareness, a healthy balance usually means your content is reaching new people while still keeping past visitors interested.
But on its own, it doesn’t tell you much. You need both. New traffic helps grow your audience, but returning visitors are often closer to converting.
Bounce Rate
Bounce Rate
This shows the percentage of visitors who land on a page and leave without clicking through to anything else.
It can be a bit of a red flag, especially if it’s high on key service or product pages. That might mean people aren’t finding what they expected, or the page isn’t answering their needs.
But it’s not always bad. A blog post might have a high bounce rate because someone found their answer and left, job done. Look at it in context and always alongside time on page and conversions.
Time on Page / Session Duration
This shows how long people are spending on your pages or on your site overall.
It can be a good sign of engagement, the longer someone stays, the more likely they’re reading, watching, or weighing things up.
That said, not every page needs to hold someone’s attention for ages. A contact page or menu might only need a few seconds. It’s not about chasing time for the sake of it, but about making sure the right pages are holding interest.
Exit Rate
This tells you which page someone was on when they decided to leave the site.
It can help flag weak points — if lots of people are dropping off from the same page, there might be a problem. Maybe the content’s flat, the call to action’s missing, or the next step isn’t clear.
But some pages are supposed to be exits. A thank you page, for example, will usually have a 100% exit rate. Like bounce rate, this metric needs context.
Conversion Rate from Organic
This shows the percentage of people who arrived via search and completed an action, like making a purchase, booking a call, or signing up.
It’s one of the most important numbers in any SEO report. It tells you whether the traffic you’re getting is actually converting.
If organic traffic is growing but conversions aren’t, it’s time to look at whether you’re ranking for the right things!
Organic Landing Pages
These are the first pages people land on when they come to your site from search.
They show you which content is attracting visitors and whether those pages are helping them take the next step. If your top landing page is a blog post with no internal links or call to action, there’s a gap to fix.
Ideally, you want your key pages like services, products or category pages showing up here too.
Search Terms / Queries
You can find these in Google Search Console, they’re the actual terms people typed in before clicking on your site.
It’s useful for spotting trends, picking up on unexpected interest, and planning future content. You can also see which terms you’re appearing for but not getting clicks, handy for improving titles or targeting intent more effectively.
Just note: the data is sampled, so it’s not a complete picture. But it’s still one of the best ways to understand what’s bringing people in.
Branded vs Non-Branded Traffic
Branded traffic comes from people searching for your business by name. Non-branded traffic comes from people searching more generally, for things you offer, but without knowing who you are yet.
You need both but the balance between them can tell you a lot.
Branded traffic reflects your reputation. It shows that your other marketing efforts like PR, social media, email, and word of mouth are working to build familiarity and trust. People are coming to you on purpose.
Non-branded traffic shows how well your content and SEO are capturing new demand. It reflects how visible you are in your market, especially when people are searching for solutions rather than specific providers.
Too much branded traffic and not enough non-branded may suggest you’re relying too heavily on existing awareness. Too much non-branded and no branded may point to low brand recognition people are finding you, but they’re not remembering you.
The real SEO dream is when your site ranks for the right non-branded terms and becomes the brand people search for next time.
Crawl Errors / Indexing Issues
These are technical issues that can stop Google from reading or listing your pages properly. You’ll find them flagged in Google Search Console or tools like Screaming Frog.
If pages aren’t being indexed, they won’t appear in search results no matter how good the content is. It’s worth checking for these regularly, especially after any big changes to your site.
Fixing crawl errors is really boring, but it’s essential maintenance. Luckily if you’re paying an SEO team, thats not your problem.
Core Web Vitals / Page Speed
Google looks at how fast your site loads and how stable it is especially on mobile. These metrics are bundled into something called Core Web Vitals. Slow or clunky pages frustrate users and can hurt your rankings. But don’t chase a perfect score just for the sake of it the goal is usability, not ticking boxes.
Run a speed test using tools like PageSpeed Insights or WebPageTest, and focus on fixing anything that slows people down.
Backlinks and Referring Domains
These are links from other websites pointing to yours. They’re still one of the most important signals Google uses to judge authority.
It’s not about getting hundreds of links, it’s about getting good ones. A few solid mentions from trusted, relevant sites are worth far more than dozens of spammy links from low-quality directories.
Keep an eye on both the number of links and the number of referring domains. It’s the quality and variety that matter most.
Cannibalisation
This happens when two or more pages on your site are competing for the same keyword. It can confuse Google and make it harder for either page to rank well. It often shows up when a site has lots of similar blog posts or duplicated service pages. Cleaning it up by consolidating content or making page intent clearer can lead to improvements in rankings. If this has been reported on by your agency, chances are they’re fixing it already.
Want more of this?
Sign up to our newsletter 👇
Unsubscribe anytime.